Manage and optimize Edge Network usage
Learn how to understand the different charts in the Vercel dashboard. Learn how usage relates to billing, and how to optimize your usage for Edge Network.This section details our improved infrastructure pricing. On April 25, 2024, these changes will apply to all new Pro customers. Starting May 25, 2024, current Pro customers will see these changes take effect on their next billing cycle. The Hobby tier remains free.
The Networking section shows the following metrics:
Top Paths displays the paths that consume the most resources on your team. These are resources such as bandwidth, execution, invocations, and requests.
This section helps you find ways to optimize your project.
In the compact view, you can view the top ten resource-consuming paths in your projects.
You can filter these by:
- Bandwidth
- Execution
- Invocations
- or Requests
Select the View button to view a full page, allowing you to apply filters such as billing cycle, date, or project.
Using Top Paths you can identify and optimize the most resource-intensive paths within your project. This is particularly useful for paths showing high bandwidth consumption.
When analyzing your bandwidth consumption you may see a path that ends with _next/image. The path will also detail a consumption value, for example, 100 GB. This would mean your application is serving a high amount of image data through Vercel's Image Optimization.
To investigate further, you can:
- Navigate to the Monitoring tab and select the Bandwidth by Optimized Image example query from the left navigation
- Select the Edit Query button and edit the Where clause to filter by
host = 'my-site.com'. The full query should look likerequest_path = '/_next/image' OR request_path = '/_vercel/image' and host = 'my-site.com'replacingmy-site.comwith your domain
This will show you the bandwidth consumption of images served through Vercel's Image Optimization for your project hosting the domain my-site.com.
Remove filters to get a better view of image optimization usage across all your projects. You can remove the host = 'my-site.com' filter on the Where clause. Use the host field on the Group By clause to filter by all your domains.
For a breakdown of the available clauses, fields, and variables that you can use to construct a query, see the Monitoring Reference page.
For more guidance on optimizing your image usage, see managing image optimization and usage costs.
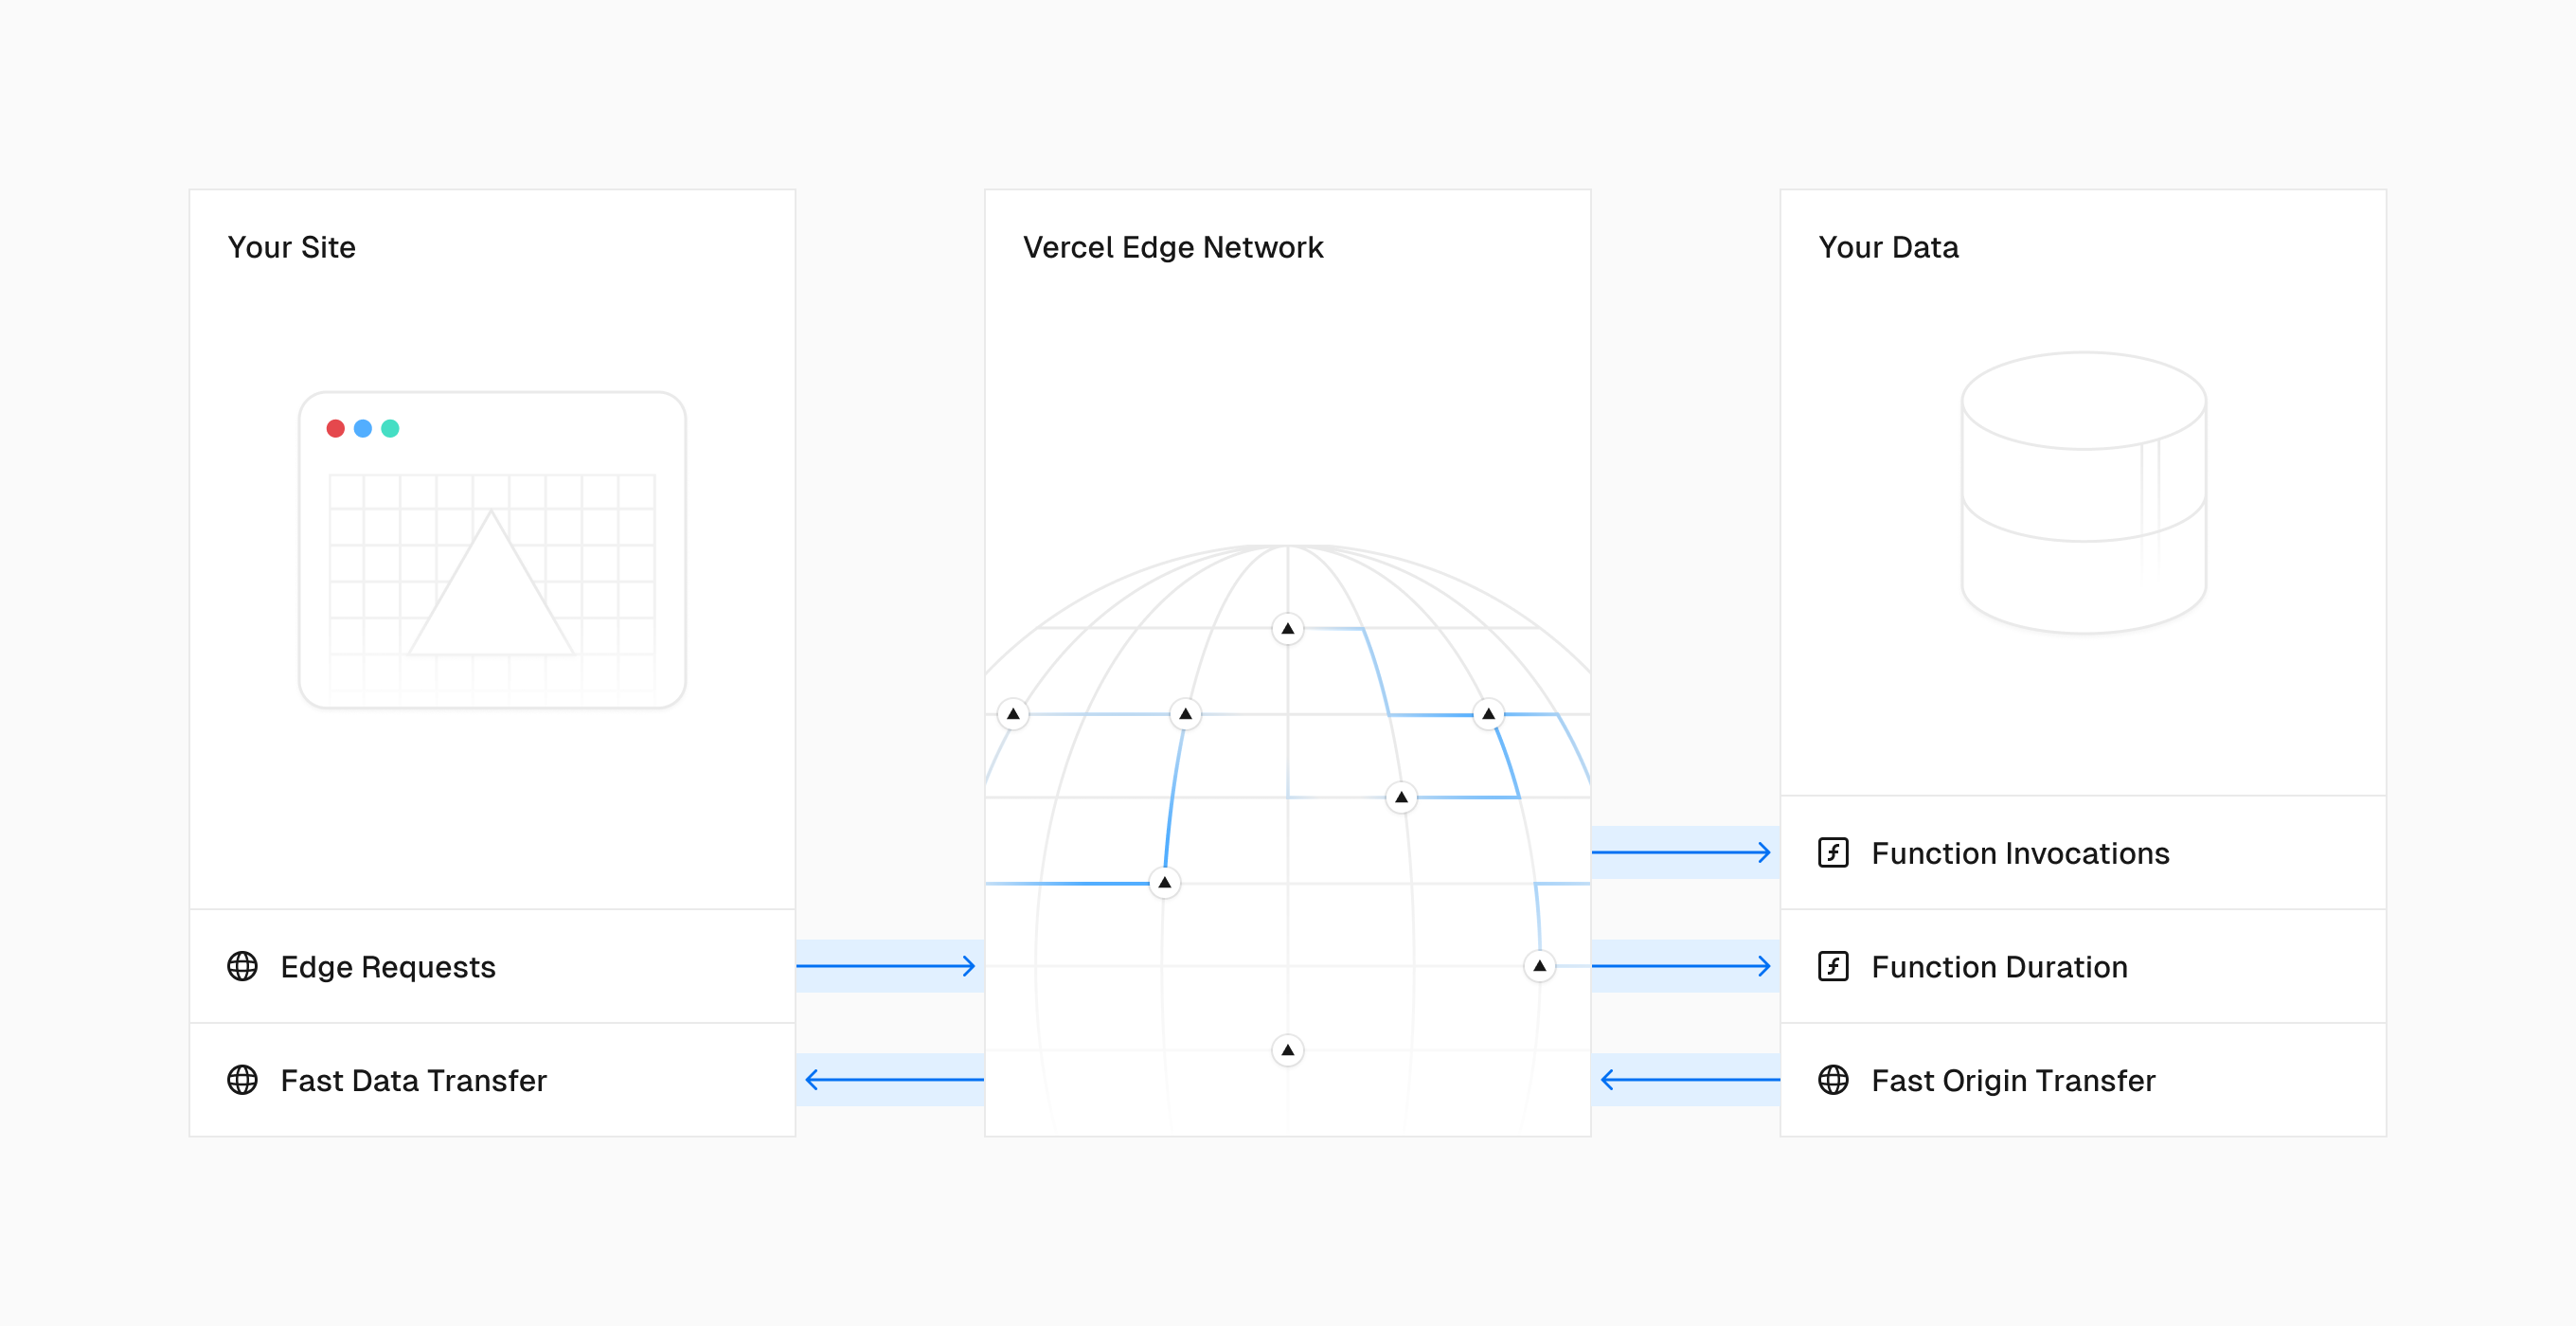
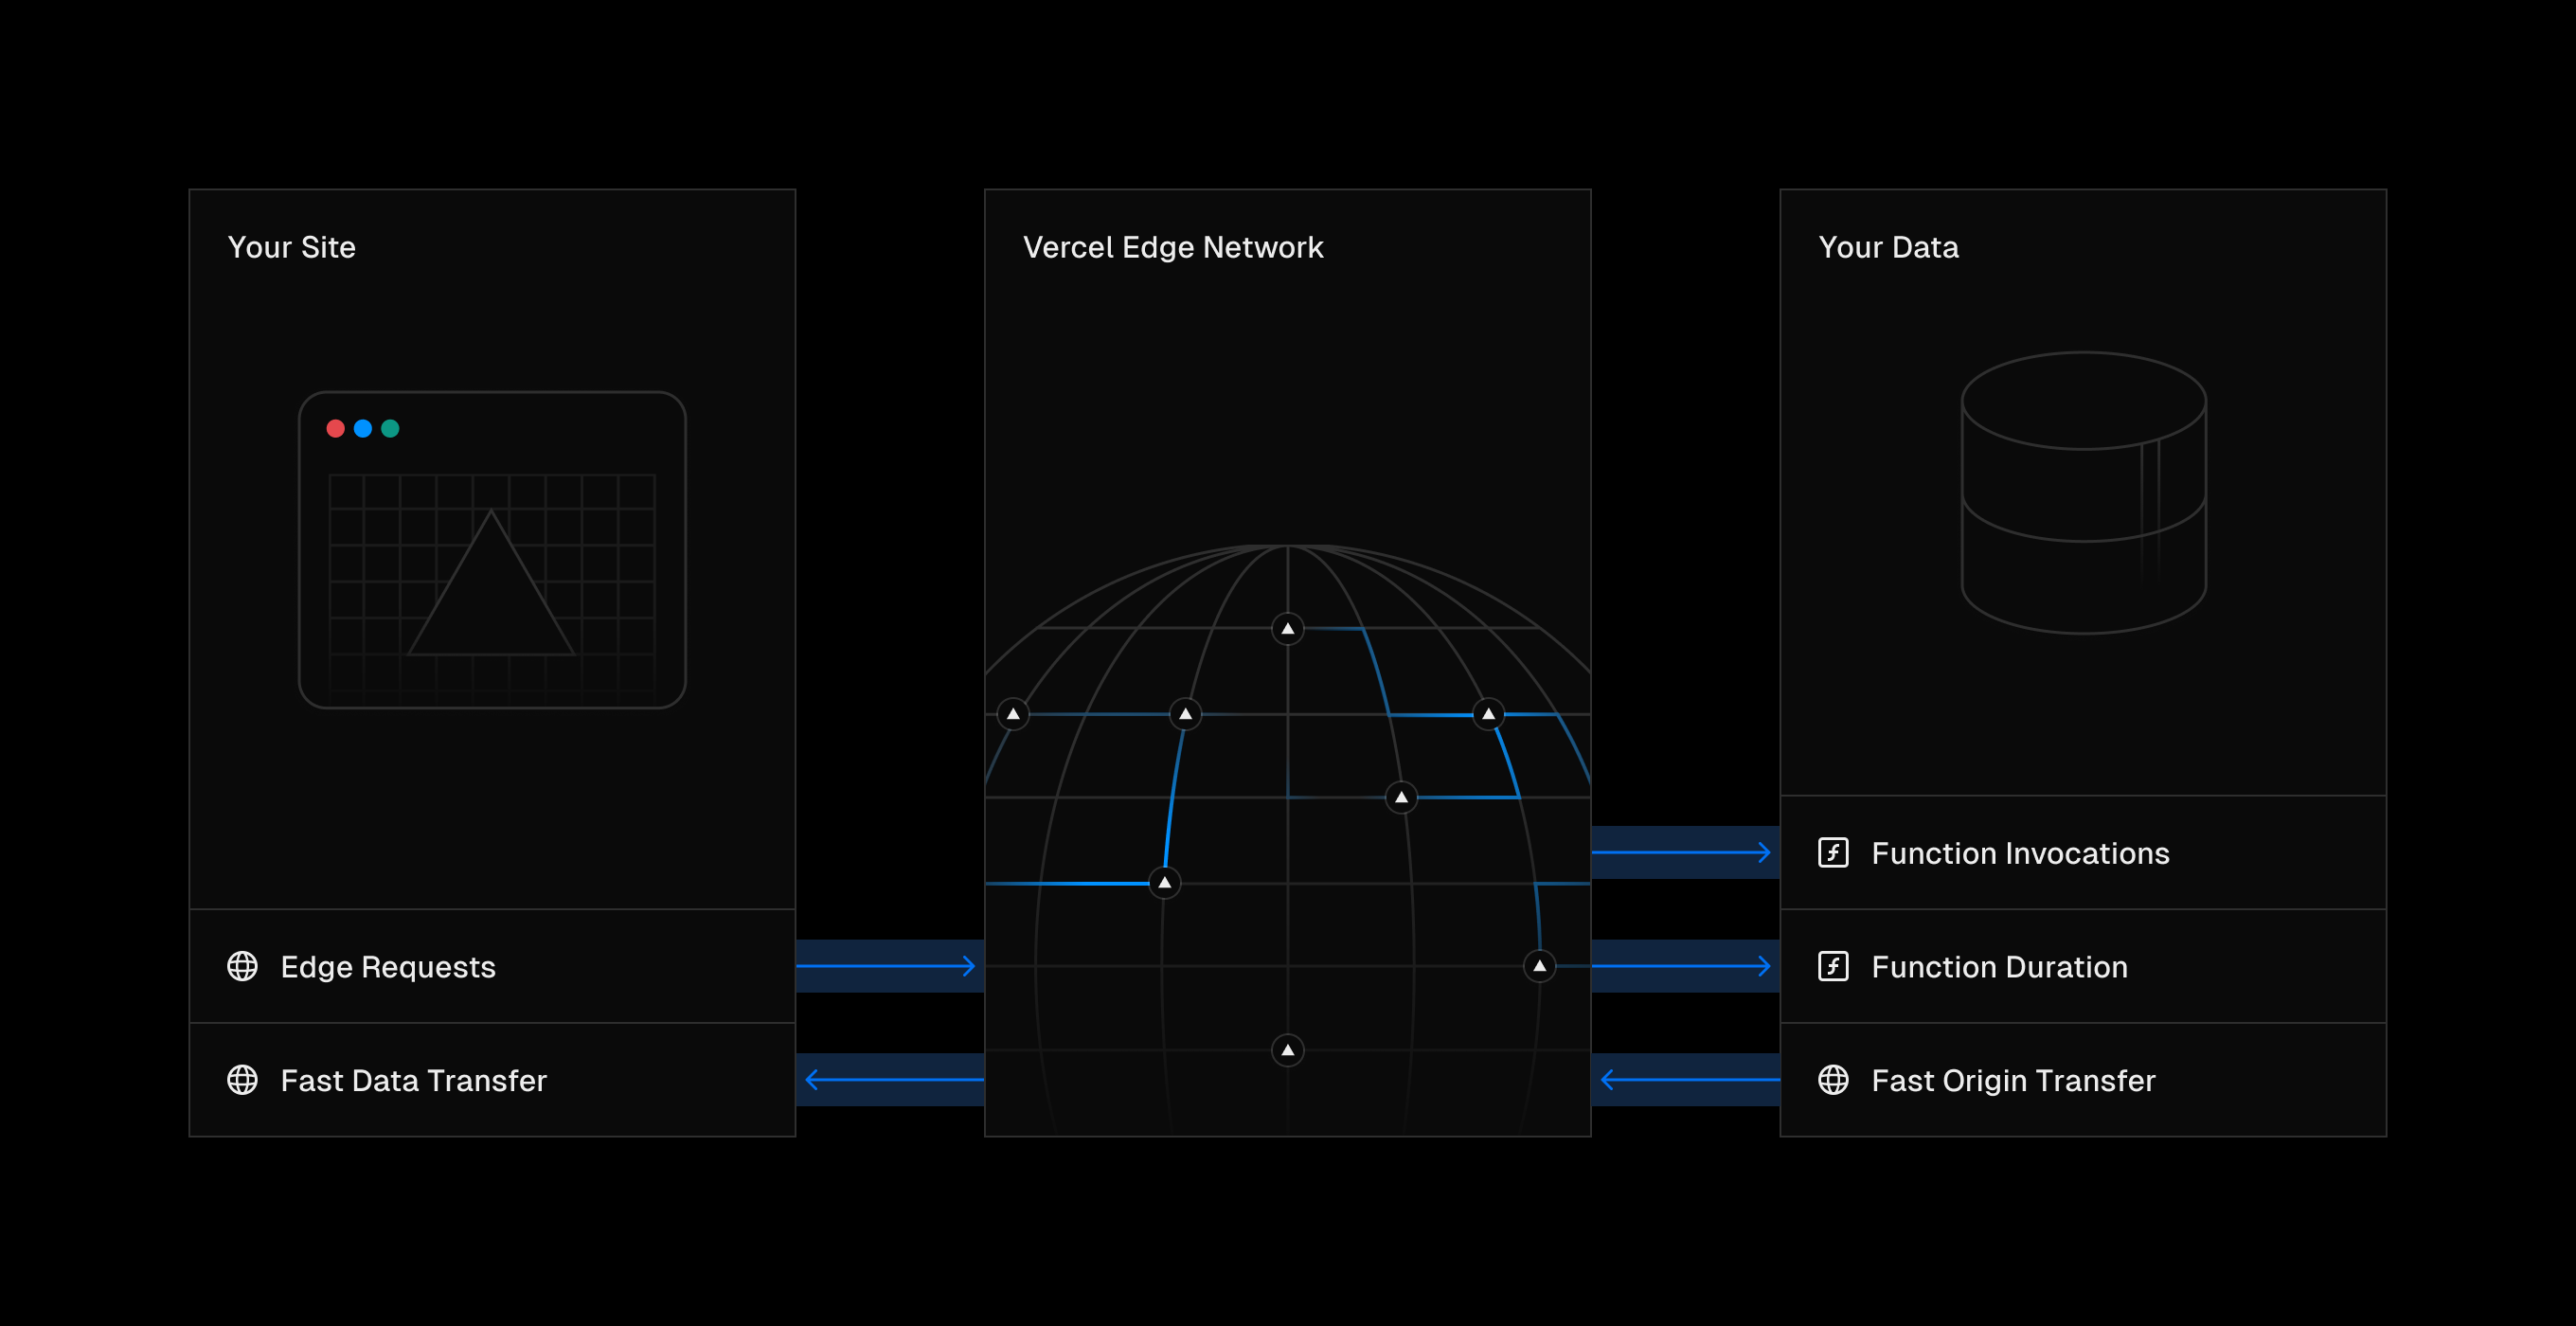
When a user visits your site, the data transfer between Vercel's Edge Network and them gets measured as Fast Data Transfer (FDT). The data transferred gets measured based on data volume transferred, and can include assets such as your homepage, images, and other static files.
FDT usage incurs alongside Edge Requests every time a user visits your site, and is priced regionally.
The Fast Data Transfer chart on the Usage tab of your dashboard shows the incoming and outgoing data transfer of your projects.
- The Direction filter allows you to see the data transfer direction (incoming or outgoing)
- The Projects filter allows you to see the data transfer of a specific project
- The Regions filter allows you to see the data transfer of a specific region. This is can be helpful due to the nature of regional pricing and FDT
As with all charts on the Usage tab, you can select the carat icon to view the chart as a full page.
To optimize FDT, you must optimize the assets that are being transferred. You can do this by:
- Using Vercel's Image Optimization: Image Optimization on Vercel uses advanced compression and modern file formats to reduce image and video file sizes. This decreases page load times and reduces FDT costs by serving optimized media tailored to the requesting device
- Analyzing your bundles: See your preferred frameworks documentation for guidance on how to analyze and reduce the size of your bundles. For Next.js, see the Bundle Analyzer guide
Similar to Top Paths, you can use the Monitoring tab to further analyze the data transfer of your projects. See the Using Top Paths and Monitoring section for an example of how to use Monitoring to analyze large image data transfer.
Fast Origin Transfer (FOT) represents data transferred between Vercel's Edge Network and Vercel Functions.
The Fast Origin Transfer (FOT) chart on the Usage tab of your dashboard shows the amount of data transferred between Vercel's Edge Network and your project's functions.
- The Direction filter allows you to see the data transfer direction (incoming or outgoing)
- The Projects filter allows you to see the data transfer of a specific project
- The Regions filter allows you to see the data transfer of a specific region. This is can be helpful due to the nature of regional pricing and FOT
As with all charts on the Usage tab, you can select the carat icon to view the chart as a full page.
To optimize FOT, you can implement caching strategies for your Vercel Function responses. By caching the response, future requests serve from the Edge Network cache, rather than invoking the function again. This reduces FOT costs and improves performance.
When users make requests to your site, each Edge Network region incurs a request. Vercel's network automatically routes users to their nearest region for the lowest latency. Edge Requests work in conjunction with Fast Data Transfer, both of which are priced based on region.
You can view the Edge Requests chart on the Usage tab of your dashboard. This chart shows:
- Count: The total count of requests made to your deployments
- Projects: The projects that received the requests
- Region: The region where the requests are made
As with all charts on the Usage tab, you can select the carat icon to view the chart in full screen mode.
Frameworks such as Next.js, SvelteKit, Nuxt, and others help build applications that automatically reduce unnecessary requests.
The most significant opportunities for optimizing Edge Requests include:
- Identifying frequent re-mounting: If your application involves rendering a large number of images and re-mounts them, it can inadvertently increase requests
- To identify: Use your browsers devtools and browse your site. Pay attention to responses with a 304 status code on repeated requests paths. This indicates content that has been fetched multiple times
- Excessive polling or data fetching: Applications that poll APIs for live updates, or use tools like SWR or React Query to reload data on user focus can contribute to increased requests
Was this helpful?